Lonta Research · Free tool
Growth happened. How much belongs to the change?
Put a before-and-after claim beside a comparison group. Inspect two assumptions before calling the difference incremental work.
Built by Lonta AI for home service account reviews. Invented examples, visible formulas, local CSV export. No signup.
Lonta field tools · 01
Put the growth claim beside a comparison.
Sold-job counts for the same two periods. All four numbers are invented until you replace them.
Use one outcome definition, equal period lengths and a consistent completion cutoff. A comparison group is a proposed reference, not automatically a valid control.
What the records say
Observed before / after
+40% of the changed group’s before count. This describes the change; it assigns no cause.
Same absolute change
Expected without the change: 130 jobs, if the changed group would have gained or lost the same number as the comparison. This is additive difference-in-differences arithmetic.
Same percentage change
Expected without the change: 130 jobs, if the changed group would have followed the comparison’s growth ratio. This is a different assumption.
Four totals cannot establish parallel trends, rule out other changes or measure uncertainty. These are conditional scenarios, not proven incremental jobs.
Inputs stay in this page. The CSV is made in your browser; nothing is submitted, stored or added to a share URL.
Before entering the four counts
Write down the change, the two groups, the dates and the definition of a sold job. Use the same completion cutoff in all four cells. The comparison should be exposed to similar outside conditions without receiving the change being reviewed.
Raw totals need comparable group scale for the same-absolute-change assumption to be credible. Different volumes do not automatically justify the percentage assumption. Review several earlier periods, service mix, spend, capacity, prices and any overlap between groups.
The tool cannot make a neighboring shop, a prior year or a different trade into a control. If the records do not support a defensible comparison, report the observed change and leave its cause unresolved.
Two assumptions, written out
Same absolute change: expected jobs without the change = changed-group before + (comparison after − comparison before). Difference = changed-group after − expected jobs. This is the two-period additive difference-in-differences calculation.
Same percentage change: expected jobs without the change = changed-group before × (comparison after ÷ comparison before). Difference = changed-group after − expected jobs. Both before counts must be positive. This proportional scenario uses a different assumption; it is not a corrected version of the first.
Invented equal-group example: 100 → 140 versus 100 → 130. Observed growth is 40 jobs, or 40% of the before count. Both comparison scenarios expect 130 jobs and leave 10 jobs unexplained by the assumed comparison trend. That is 10 jobs, not a proven effect or a 10% lift over the expected 130.
Invented unequal-group example: 100 → 140 versus 400 → 520. The absolute-change scenario expects 220 and gives −80 jobs; the percentage scenario expects 130 and gives +10. The disagreement is a reason to examine the assumptions, not choose the positive answer.
What four totals cannot tell you
The tool has no records for uncertainty, group assignment, pre-change trends, seasonality, job value or the effects of simultaneous changes. No confidence interval, significance test, ROAS, budget recommendation or causal verdict is produced.
A negative expected count makes the additive scenario unusable for job counts. A zero before count leaves relevant ratios undefined. Fractional scenario outputs are expected values, not fractional observed jobs. An empty export cell means undefined, not zero.
Read the full worked guide and the weather and capacity review. Use the lead-cost calculator for job economics, and HVAC marketing for the service context.
Take the question to an account review
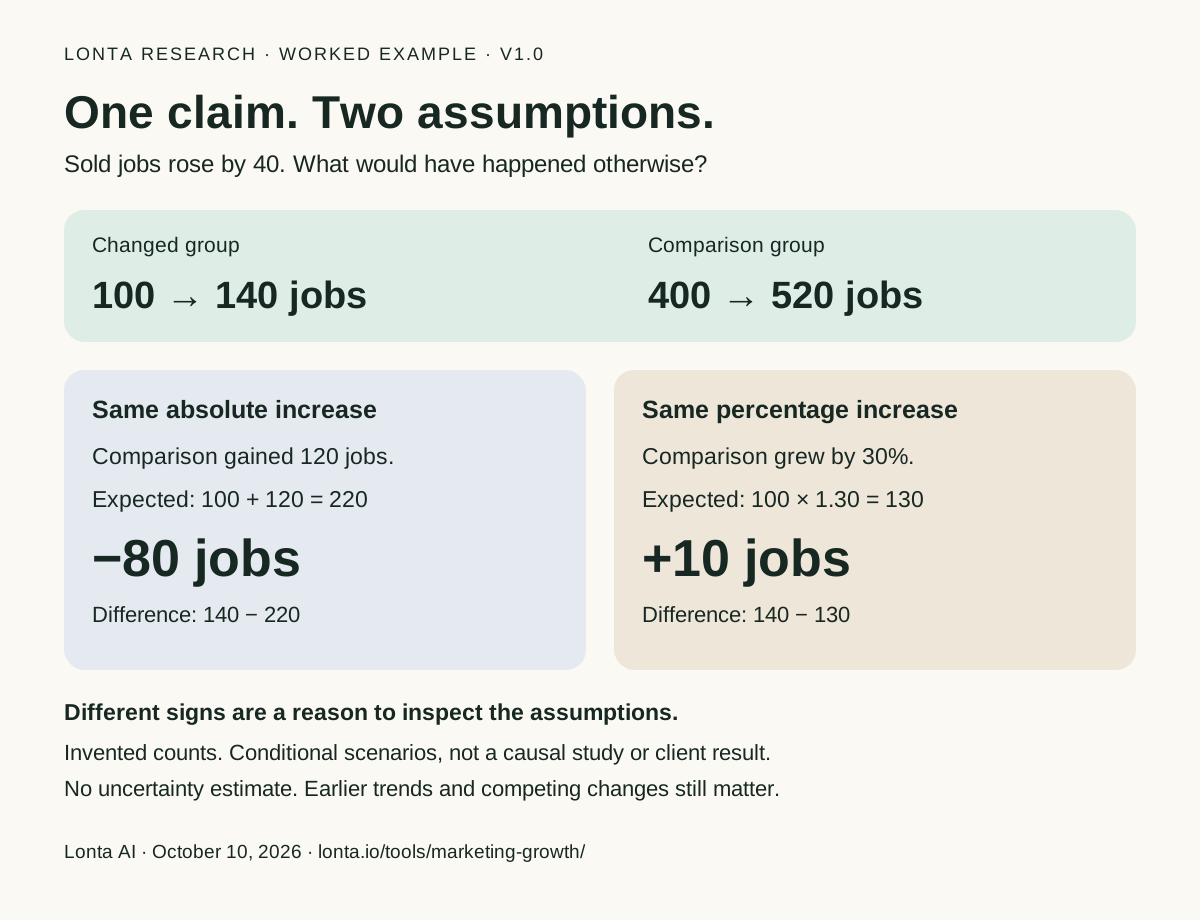
The worksheet records the group definitions and competing explanations that a four-number calculator cannot hold. Start there before running a spend experiment.
The original Lonta diagram and worksheet may be copied or adapted for editorial and commercial use. Keep the invented-example label and limitations with the numbers. Attribution is welcome; a link is not required. Third-party source material retains its own rights.
Questions about the calculator
Does this calculator prove marketing caused the growth?
No. It calculates two conditional comparisons from four totals. It does not establish a valid control, estimate uncertainty or rule out other changes.
Why do the two comparisons give different answers?
One assumes the changed group would have gained the same number of jobs as the comparison. The other assumes it would have grown by the same ratio. Different starting volumes can make those assumptions produce different answers.
Are my job counts uploaded or saved?
No. The calculation and CSV export happen in your browser. Inputs are not submitted, saved or included in a share URL.
Method references
Checked October 10, 2026. The calculator and examples are Lonta's own implementation; these sources do not endorse it.
- World Bank: assumptions behind difference-in-differences.
- World Bank: parallel trends, functional form and pre-trend testing.
- Google Ads: controlled lift studies. This calculator does not run a Google lift study.