Skip to content
Back

Lonta Research · HVAC seasonality calendar

Your HVAC season starts locally.

Compare the heating and cooling calendar in 24 US cities. We analyzed NOAA's monthly climate normals and kept each airport station, measurement period and quality flag attached to the numbers.

24

city reference stations
12 months · 65°F base
1991–2020 climate normals

Analysis by Lonta AI · NOAA source files checked October 9, 2026 · Version 1.0

Put two local calendars side by side

Choose airport stations near your markets. Both charts use the same scale and start at zero. These are historical climate normals, not this year's weather or a forecast of leads.

Cooling degree days · 65°F base · 1991–2020 normals · Dallas–Fort Worth and Phoenix

First market

Dallas–Fort Worth, TX

DALLAS FT WORTH AP, TX US
NOAA station USW00003927

0945.4 °F-days
  1. Jan (January)2.4
  2. Feb (February)7.5
  3. Mar (March)35.4
  4. Apr (April)101.9
  5. May (May)290.4
  6. Jun (June)505.5
  7. Jul (July)641.6
  8. Aug (August)643.0
  9. Sep (September)409.8
  10. Oct (October)154.5
  11. Nov (November)27.3
  12. Dec (December)4.5
Highest monthly normal
August · 643.0 °F-days
Three largest months
63.4% of the 12-month totalJune / July / August
Inspect this station's values & flags ↓

Comparison market

Phoenix, AZ

PHOENIX SKY HARBOR INTL AP, AZ US
NOAA station USW00023183

0945.4 °F-days
  1. Jan (January)2.0
  2. Feb (February)16.3
  3. Mar (March)105.0
  4. Apr (April)258.9
  5. May (May)527.8
  6. Jun (June)791.9
  7. Jul (July)945.4
  8. Aug (August)909.8
  9. Sep (September)727.4
  10. Oct (October)390.2
  11. Nov (November)88.1
  12. Dec (December)1.9
Highest monthly normal
July · 945.4 °F-days
Three largest months
55.6% of the 12-month totalJune / July / August
Inspect this station's values & flags ↓

* NOAA flag X: a nonzero value rounded to zero. The three-month share describes weather concentration, not a share of annual calls, jobs or advertising spend. Station-year coverage and completeness flags are in the records below.

One summer calendar misses local differences

Even Dallas and Phoenix peak in different months.

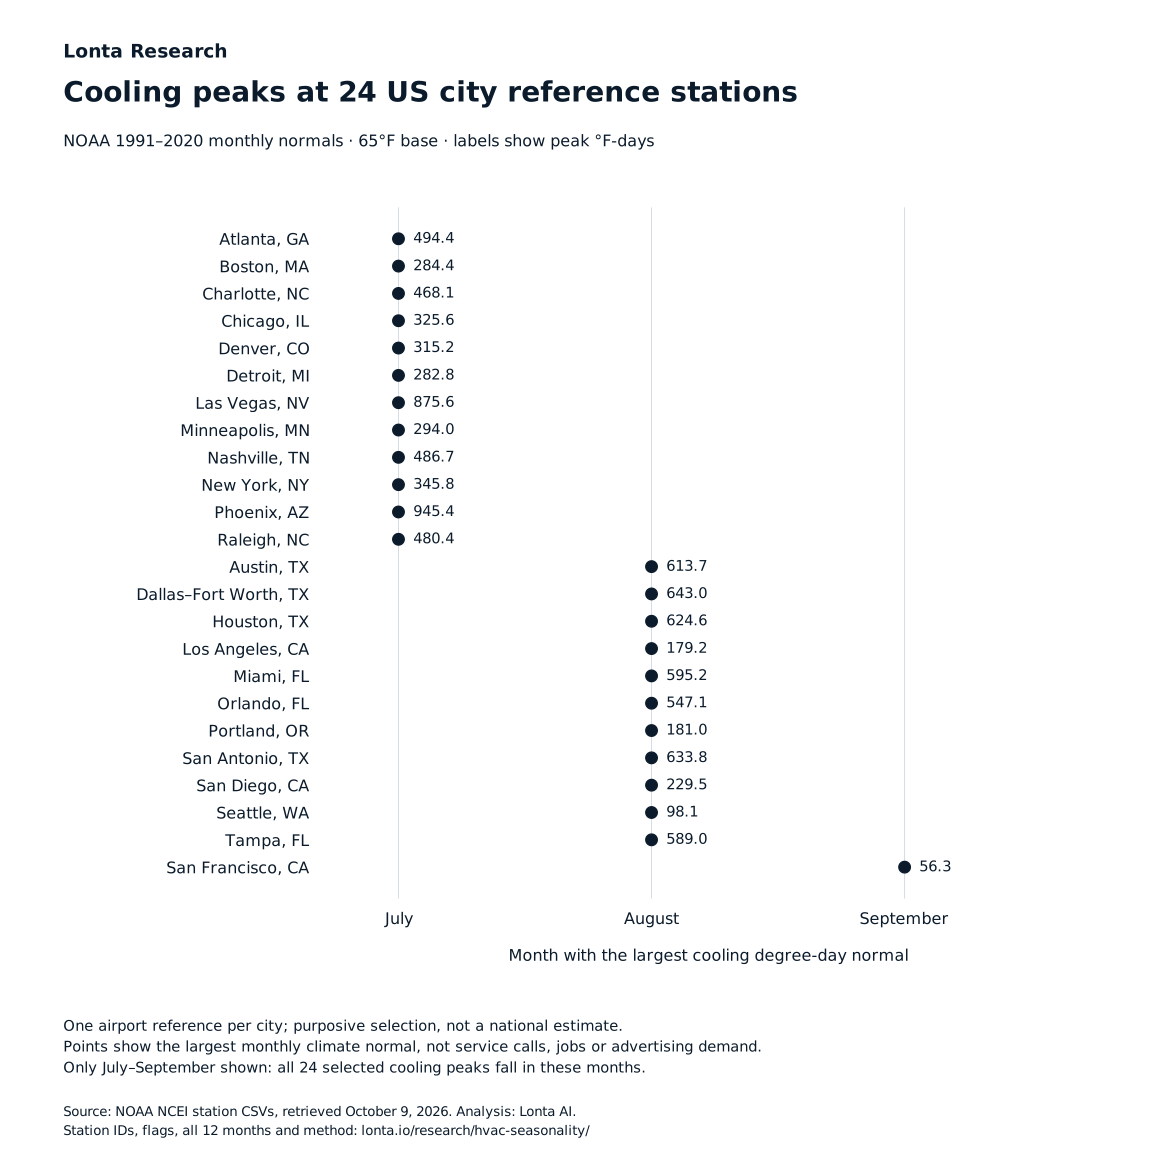
The highest cooling normal is 643.0 °F-days in August at Dallas–Fort Worth Airport, and 945.4 °F-days in July at Phoenix Sky Harbor. A single “July is the peak” calendar loses that distinction.

Inspect Dallas's source values ↓

Three summer months represent different shares of the year.

The three largest cooling months contain 83.3% of Boston Logan's 12-month cooling total and 37.0% at Miami International. This is weather concentration. It does not say what fraction of each contractor's jobs happens then.

Inspect Miami's source values ↓

Coastal stations add another complication: San Francisco International's largest cooling normal occurs in September. Los Angeles International peaks in August. An airport can also be cooler than an inland service area, so match the reference point to the addresses your crews actually reach.

Use a local calendar to choose what to check: staffed phone hours, technician availability, maintenance outreach and landing-page promises. Your own completed jobs, equipment mix and service-area conditions determine the business plan.

The 24 station calendars at a glance

Peak means the largest published monthly normal at this station. The three-month share uses the three largest cooling months, which need not be June–August. This selection is not a ranking or a representative sample of all US markets.

NOAA 1991–2020 normals · heating and cooling base 65°F
City referenceHeating peakCooling peakCooling in three largest months
Atlanta, GA ↓JanuaryJuly65.9%
Austin, TX ↓JanuaryAugust58.0%
Boston, MA ↓JanuaryJuly83.3%
Charlotte, NC ↓JanuaryJuly70.1%
Chicago, IL ↓JanuaryJuly79.9%
Dallas–Fort Worth, TX ↓JanuaryAugust63.4%
Denver, CO ↓DecemberJuly84.4%
Detroit, MI ↓JanuaryJuly81.7%
Houston, TX ↓JanuaryAugust54.4%
Las Vegas, NV ↓DecemberJuly64.0%
Los Angeles, CA ↓DecemberAugust66.2%
Miami, FL ↓JanuaryAugust37.0%
Minneapolis, MN ↓JanuaryJuly83.0%
Nashville, TN ↓JanuaryJuly69.7%
New York, NY ↓JanuaryJuly82.0%
Orlando, FL ↓JanuaryAugust45.7%
Phoenix, AZ ↓DecemberJuly55.6%
Portland, OR ↓DecemberAugust83.7%
Raleigh, NC ↓JanuaryJuly70.0%
San Antonio, TX ↓JanuaryAugust56.4%
San Diego, CA ↓DecemberAugust68.1%
San Francisco, CA ↓JanuarySeptember64.9%
Seattle, WA ↓DecemberAugust84.8%
Tampa, FL ↓JanuaryAugust43.5%

Open a station record below for all twelve months and the underlying completeness/year flags. A monthly total also reflects month length; it is not a daily intensity measure.

Every month, with its source

S = Standard; R = Representative. The number beside the flag is NOAA's years field for that variable and month. X marks a nonzero value rounded to zero. The downloads retain these fields separately.

Atlanta, GA · USW00013874

ATLANTA HARTSFIELD INTL AP, GA US
Latitude 33.63 · Longitude -84.4417 · Elevation 307.8 m

Lowest combined heating + cooling normal: April. This is an unweighted weather calculation, not a prediction of a slow business month.

Monthly degree days (°F-days) · 65°F base · 1991–2020
MonthHeatingCoolingHeating / cooling flags & years
January626.70.6S25 / S25
February462.52.0S25 / S25
March308.517.1S25 / S25
April119.764.2S24 / S24
May21.9214.0S25 / S25
June1.1386.5S25 / S25
July0.0494.4S25 / S25
August0.1469.7S24 / S24
September5.4302.3S25 / S25
October98.687.8S26 / S26
November335.910.4S25 / S25
December550.51.9S25 / S25
Open NOAA's original station CSV ↗
Austin, TX · USW00013904

AUSTIN BERGSTROM AP, TX US
Latitude 30.1831 · Longitude -97.68 · Elevation 146.3 m

Lowest combined heating + cooling normal: April. This is an unweighted weather calculation, not a prediction of a slow business month.

Monthly degree days (°F-days) · 65°F base · 1991–2020
MonthHeatingCoolingHeating / cooling flags & years
January469.57.7R24 / R24
February321.020.0R24 / R24
March183.761.3R24 / R24
April52.1145.1R24 / R24
May3.8344.8R24 / R24
June0.0517.4R24 / R24
July0.0606.0R24 / R24
August0.0613.7R24 / R24
September1.2422.7S25 / S25
October44.4194.8R24 / R24
November219.348.4S26 / S26
December423.214.1R25 / R25
Open NOAA's original station CSV ↗
Boston, MA · USW00014739

BOSTON LOGAN INTL AP, MA US
Latitude 42.3606 · Longitude -71.0106 · Elevation 3.7 m

Lowest combined heating + cooling normal: September. This is an unweighted weather calculation, not a prediction of a slow business month.

Monthly degree days (°F-days) · 65°F base · 1991–2020
MonthHeatingCoolingHeating / cooling flags & years
January1,086.40.0S28 / S28
February929.60.0S28 / S28
March828.20.5S28 / S28
April496.14.1S28 / S28
May233.929.3S28 / S28
June49.8138.2S27 / S27
July4.0284.4S27 / S27
August4.8245.0S27 / S27
September71.390.7S27 / S27
October325.59.3S27 / S27
November607.80.3S27 / S27
December908.30.0S27 / S27
Open NOAA's original station CSV ↗
Charlotte, NC · USW00013881

CHARLOTTE DOUGLAS AP, NC US
Latitude 35.2236 · Longitude -80.9553 · Elevation 221.9 m

Lowest combined heating + cooling normal: May. This is an unweighted weather calculation, not a prediction of a slow business month.

Monthly degree days (°F-days) · 65°F base · 1991–2020
MonthHeatingCoolingHeating / cooling flags & years
January711.60.2S28 / S28
February540.51.5S27 / S27
March391.510.2S28 / S28
April162.647.1S28 / S28
May39.3164.8S28 / S28
June1.9348.3S28 / S28
July0.1468.1S29 / S29
August0.1423.2S29 / S29
September13.1244.1S29 / S29
October151.553.9S29 / S29
November415.15.7S29 / S29
December630.61.4S28 / S28
Open NOAA's original station CSV ↗
Chicago, IL · USW00094846

CHICAGO OHARE INTL AP, IL US
Latitude 41.995 · Longitude -87.9336 · Elevation 200.6 m

Lowest combined heating + cooling normal: September. This is an unweighted weather calculation, not a prediction of a slow business month.

Monthly degree days (°F-days) · 65°F base · 1991–2020
MonthHeatingCoolingHeating / cooling flags & years
January1,233.50.0S28 / S28
February1,014.90.0*S29 / S29
March808.12.0S28 / S28
April468.27.7S28 / S28
May198.060.0S28 / S28
June31.4199.3S28 / S28
July1.8325.6S28 / S28
August4.1276.8S28 / S28
September77.2116.1S28 / S28
October354.815.4S28 / S28
November712.90.4S27 / S27
December1,069.30.0S28 / S28
Open NOAA's original station CSV ↗
Dallas–Fort Worth, TX · USW00003927

DALLAS FT WORTH AP, TX US
Latitude 32.8978 · Longitude -97.0189 · Elevation 170.7 m

Lowest combined heating + cooling normal: April. This is an unweighted weather calculation, not a prediction of a slow business month.

Monthly degree days (°F-days) · 65°F base · 1991–2020
MonthHeatingCoolingHeating / cooling flags & years
January582.02.4S25 / S25
February413.47.5S26 / S26
March246.235.4S25 / S25
April82.4101.9S26 / S26
May9.9290.4S26 / S26
June0.1505.5S25 / S25
July0.0641.6S25 / S25
August0.0643.0S25 / S25
September3.4409.8S24 / S24
October69.2154.5S24 / S24
November285.227.3S24 / S24
December528.34.5S25 / S25
Open NOAA's original station CSV ↗
Denver, CO · USW00003017

DENVER INTL AP, CO US
Latitude 39.8328 · Longitude -104.6575 · Elevation 1,650.2 m

Lowest combined heating + cooling normal: June. This is an unweighted weather calculation, not a prediction of a slow business month.

Monthly degree days (°F-days) · 65°F base · 1991–2020
MonthHeatingCoolingHeating / cooling flags & years
January1,033.90.0S25 / S25
February904.20.0S25 / S25
March725.60.0*S26 / S26
April517.11.2S25 / S25
May261.325.7S25 / S25
June51.5147.4S25 / S25
July3.8315.2R22 / R22
August9.3254.1S25 / S25
September105.399.2S25 / S25
October435.86.6S25 / S25
November766.60.1S25 / S25
December1,047.60.0S25 / S25
Open NOAA's original station CSV ↗
Detroit, MI · USW00094847

DETROIT METRO AP, MI US
Latitude 42.2314 · Longitude -83.3308 · Elevation 192.3 m

Lowest combined heating + cooling normal: September. This is an unweighted weather calculation, not a prediction of a slow business month.

Monthly degree days (°F-days) · 65°F base · 1991–2020
MonthHeatingCoolingHeating / cooling flags & years
January1,216.50.0S25 / S25
February1,035.90.0*S25 / S25
March860.90.7S25 / S25
April487.54.5S25 / S25
May197.750.4S27 / S27
June28.1176.5S27 / S27
July2.4282.8S26 / S26
August6.6232.8S26 / S26
September91.489.7S26 / S26
October381.69.6S26 / S26
November712.50.0*S26 / S26
December1,046.10.0S26 / S26
Open NOAA's original station CSV ↗
Houston, TX · USW00012960

HOUSTON INTERCONT AP, TX US
Latitude 29.98 · Longitude -95.36 · Elevation 29.0 m

Lowest combined heating + cooling normal: March. This is an unweighted weather calculation, not a prediction of a slow business month.

Monthly degree days (°F-days) · 65°F base · 1991–2020
MonthHeatingCoolingHeating / cooling flags & years
January365.917.2S25 / S25
February236.031.7S26 / S26
March122.585.3S25 / S25
April30.9179.4S24 / S24
May1.2384.0S25 / S25
June0.0539.9S25 / S25
July0.0623.1S25 / S25
August0.0624.6S25 / S25
September0.3465.3S25 / S25
October26.5238.8S26 / S26
November158.269.7S26 / S26
December324.828.8S26 / S26
Open NOAA's original station CSV ↗
Las Vegas, NV · USW00023169

LAS VEGAS MCCARRAN AP, NV US
Latitude 36.0719 · Longitude -115.1633 · Elevation 649.5 m

Lowest combined heating + cooling normal: April. This is an unweighted weather calculation, not a prediction of a slow business month.

Monthly degree days (°F-days) · 65°F base · 1991–2020
MonthHeatingCoolingHeating / cooling flags & years
January480.50.0*S27 / S27
February323.31.3S27 / S27
March166.236.0S28 / S28
April54.8135.8S27 / S27
May8.2389.5S28 / S28
June0.7678.6S28 / S28
July0.0875.6S28 / S28
August0.0827.6S28 / S28
September0.3559.7S27 / S27
October32.5199.9S27 / S27
November250.016.0S27 / S27
December519.10.1S27 / S27
Open NOAA's original station CSV ↗
Los Angeles, CA · USW00023174

LOS ANGELES INTL AP, CA US
Latitude 33.9381 · Longitude -118.3889 · Elevation 29.6 m

Lowest combined heating + cooling normal: June. This is an unweighted weather calculation, not a prediction of a slow business month.

Monthly degree days (°F-days) · 65°F base · 1991–2020
MonthHeatingCoolingHeating / cooling flags & years
January227.45.8S27 / S27
February207.37.1S27 / S27
March189.88.5S26 / S26
April132.517.0S26 / S26
May69.524.5S26 / S26
June13.056.5S26 / S26
July1.5142.5S26 / S26
August1.0179.2S26 / S26
September2.4155.4S27 / S27
October26.091.1S26 / S26
November111.230.2S26 / S26
December232.02.6S26 / S26
Open NOAA's original station CSV ↗
Miami, FL · USW00012839

MIAMI INTL AP, FL US
Latitude 25.7906 · Longitude -80.3164 · Elevation 8.8 m

Lowest combined heating + cooling normal: January. This is an unweighted weather calculation, not a prediction of a slow business month.

Monthly degree days (°F-days) · 65°F base · 1991–2020
MonthHeatingCoolingHeating / cooling flags & years
January43.7155.5R25 / R25
February22.0181.5S26 / S26
March8.4259.5S26 / S26
April0.5351.5S26 / S26
May0.0*466.5S26 / S26
June0.0534.0S26 / S26
July0.0590.5S27 / S27
August0.0595.2S27 / S27
September0.0538.5S27 / S27
October0.2466.7S27 / S27
November3.3297.3S27 / S27
December25.5219.3S26 / S26
Open NOAA's original station CSV ↗
Minneapolis, MN · USW00014922

MINNEAPOLIS/ST PAUL AP, MN US
Latitude 44.8831 · Longitude -93.2289 · Elevation 265.8 m

Lowest combined heating + cooling normal: June. This is an unweighted weather calculation, not a prediction of a slow business month.

Monthly degree days (°F-days) · 65°F base · 1991–2020
MonthHeatingCoolingHeating / cooling flags & years
January1,512.60.0S27 / S27
February1,243.10.0S27 / S27
March983.20.4S27 / S27
April542.23.7S27 / S27
May213.944.9S27 / S27
June34.4175.3S26 / S26
July4.3294.0S26 / S26
August10.3219.5S26 / S26
September127.684.0S27 / S27
October488.68.1S27 / S27
November906.00.1S27 / S27
December1,332.90.0S27 / S27
Open NOAA's original station CSV ↗
Nashville, TN · USW00013897

NASHVILLE INTL AP, TN US
Latitude 36.1189 · Longitude -86.6892 · Elevation 182.9 m

Lowest combined heating + cooling normal: May. This is an unweighted weather calculation, not a prediction of a slow business month.

Monthly degree days (°F-days) · 65°F base · 1991–2020
MonthHeatingCoolingHeating / cooling flags & years
January787.50.3S27 / S27
February606.11.3S27 / S27
March430.710.6S27 / S27
April179.752.2S26 / S26
May41.9176.7S26 / S26
June1.3362.8S26 / S26
July0.0*486.7S26 / S26
August0.1455.8S26 / S26
September14.4257.3S25 / S25
October164.662.2S26 / S26
November446.96.0S27 / S27
December690.81.1S26 / S26
Open NOAA's original station CSV ↗
New York, NY · USW00094789

NEW YORK JFK INTL AP, NY US
Latitude 40.6386 · Longitude -73.7622 · Elevation 3.4 m

Lowest combined heating + cooling normal: September. This is an unweighted weather calculation, not a prediction of a slow business month.

Monthly degree days (°F-days) · 65°F base · 1991–2020
MonthHeatingCoolingHeating / cooling flags & years
January996.50.0S27 / S27
February852.60.0S27 / S27
March739.30.0*S27 / S27
April426.82.4S27 / S27
May171.230.2S28 / S28
June20.8176.7S28 / S28
July0.3345.8S27 / S27
August0.8310.7S27 / S27
September33.4135.3S27 / S27
October255.415.2S27 / S27
November546.10.1S27 / S27
December829.20.0S27 / S27
Open NOAA's original station CSV ↗
Orlando, FL · USW00012815

ORLANDO INTL AP, FL US
Latitude 28.4339 · Longitude -81.325 · Elevation 27.4 m

Lowest combined heating + cooling normal: February. This is an unweighted weather calculation, not a prediction of a slow business month.

Monthly degree days (°F-days) · 65°F base · 1991–2020
MonthHeatingCoolingHeating / cooling flags & years
January180.145.5S26 / S26
February104.866.9S27 / S27
March54.4127.3S27 / S27
April9.6224.1S27 / S27
May0.5383.3S27 / S27
June0.0485.9S27 / S27
July0.0545.6S27 / S27
August0.0547.1S26 / S26
September0.0*479.9S26 / S26
October5.5329.4S26 / S26
November42.6140.2S26 / S26
December127.476.3S26 / S26
Open NOAA's original station CSV ↗
Phoenix, AZ · USW00023183

PHOENIX SKY HARBOR INTL AP, AZ US
Latitude 33.4278 · Longitude -112.0039 · Elevation 337.4 m

Lowest combined heating + cooling normal: March. This is an unweighted weather calculation, not a prediction of a slow business month.

Monthly degree days (°F-days) · 65°F base · 1991–2020
MonthHeatingCoolingHeating / cooling flags & years
January256.22.0S28 / S28
February159.016.3S27 / S27
March64.7105.0S27 / S27
April14.3258.9S27 / S27
May0.8527.8S27 / S27
June0.0791.9S27 / S27
July0.0945.4S27 / S27
August0.0909.8S27 / S27
September0.0727.4S27 / S27
October5.8390.2S27 / S27
November85.088.1S27 / S27
December288.51.9S28 / S28
Open NOAA's original station CSV ↗
Portland, OR · USW00024229

PORTLAND INTL AP, OR US
Latitude 45.5908 · Longitude -122.6003 · Elevation 5.8 m

Lowest combined heating + cooling normal: September. This is an unweighted weather calculation, not a prediction of a slow business month.

Monthly degree days (°F-days) · 65°F base · 1991–2020
MonthHeatingCoolingHeating / cooling flags & years
January717.70.0S27 / S27
February583.80.0S27 / S27
March519.30.0*S27 / S27
April366.62.1S27 / S27
May196.020.9S27 / S27
June80.056.0S29 / S29
July10.2171.3S29 / S29
August7.4181.0S29 / S29
September60.972.8S29 / S29
October296.53.6S29 / S29
November538.50.0S28 / S28
December726.90.0S27 / S27
Open NOAA's original station CSV ↗
Raleigh, NC · USW00013722

RALEIGH DURHAM INTL AP, NC US
Latitude 35.8922 · Longitude -78.7819 · Elevation 126.8 m

Lowest combined heating + cooling normal: May. This is an unweighted weather calculation, not a prediction of a slow business month.

Monthly degree days (°F-days) · 65°F base · 1991–2020
MonthHeatingCoolingHeating / cooling flags & years
January718.00.5S29 / S29
February561.71.7S29 / S29
March420.911.8S29 / S29
April180.054.0S29 / S29
May46.8166.1S29 / S29
June3.1354.1S29 / S29
July0.0*480.4S29 / S29
August0.1427.8S29 / S29
September14.7242.6S29 / S29
October159.856.0S29 / S29
November411.97.0S29 / S29
December636.32.5S29 / S29
Open NOAA's original station CSV ↗
San Antonio, TX · USW00012921

SAN ANTONIO INTL AP, TX US
Latitude 29.5442 · Longitude -98.4839 · Elevation 240.5 m

Lowest combined heating + cooling normal: April. This is an unweighted weather calculation, not a prediction of a slow business month.

Monthly degree days (°F-days) · 65°F base · 1991–2020
MonthHeatingCoolingHeating / cooling flags & years
January405.57.3S26 / S26
February265.922.3S26 / S26
March139.271.0S26 / S26
April35.2165.7S25 / S25
May2.8359.3S25 / S25
June0.0526.4S25 / S25
July0.0613.8R23 / R23
August0.0633.8S24 / S24
September1.0446.5S24 / S24
October34.0229.3S24 / S24
November185.658.1S25 / S25
December369.214.3S26 / S26
Open NOAA's original station CSV ↗
San Diego, CA · USW00023188

SAN DIEGO LINDBERGH FLD, CA US
Latitude 32.7336 · Longitude -117.1831 · Elevation 4.6 m

Lowest combined heating + cooling normal: May. This is an unweighted weather calculation, not a prediction of a slow business month.

Monthly degree days (°F-days) · 65°F base · 1991–2020
MonthHeatingCoolingHeating / cooling flags & years
January209.23.0R23 / R23
February172.84.8R23 / R23
March141.59.8R23 / R23
April84.723.2R23 / R23
May44.837.0R22 / R22
June10.274.7R22 / R22
July0.6177.3R23 / R23
August0.1229.5R23 / R23
September0.4201.3R23 / R23
October11.4105.9S24 / S24
November93.025.5R23 / R23
December221.21.2R23 / R23
Open NOAA's original station CSV ↗
San Francisco, CA · USW00023234

SAN FRANCISCO INTL AP, CA US
Latitude 37.6197 · Longitude -122.3647 · Elevation 2.4 m

Lowest combined heating + cooling normal: July. This is an unweighted weather calculation, not a prediction of a slow business month.

Monthly degree days (°F-days) · 65°F base · 1991–2020
MonthHeatingCoolingHeating / cooling flags & years
January426.20.0S26 / S26
February323.40.0*S26 / S26
March295.51.0S26 / S26
April234.34.8R25 / R25
May170.013.5S26 / S26
June96.923.4S26 / S26
July58.425.9S25 / S25
August44.040.9S26 / S26
September45.856.3S26 / S26
October99.532.8S26 / S26
November259.61.7S26 / S26
December421.50.0S26 / S26
Open NOAA's original station CSV ↗
Seattle, WA · USW00024233

SEATTLE TACOMA INTL AP, WA US
Latitude 47.4444 · Longitude -122.3139 · Elevation 112.8 m

Lowest combined heating + cooling normal: August. This is an unweighted weather calculation, not a prediction of a slow business month.

Monthly degree days (°F-days) · 65°F base · 1991–2020
MonthHeatingCoolingHeating / cooling flags & years
January686.70.0S27 / S27
February588.00.0S27 / S27
March556.60.2S26 / S26
April411.90.9S26 / S26
May241.89.3S26 / S26
June117.929.4S26 / S26
July31.196.1S25 / S25
August23.798.1S25 / S25
September102.430.4S26 / S26
October349.30.5S27 / S27
November555.00.0S27 / S27
December711.40.0S27 / S27
Open NOAA's original station CSV ↗
Tampa, FL · USW00012842

TAMPA INTL AP, FL US
Latitude 27.9619 · Longitude -82.5403 · Elevation 5.8 m

Lowest combined heating + cooling normal: February. This is an unweighted weather calculation, not a prediction of a slow business month.

Monthly degree days (°F-days) · 65°F base · 1991–2020
MonthHeatingCoolingHeating / cooling flags & years
January152.160.9S29 / S29
February88.181.1S29 / S29
March44.2154.3S28 / S28
April6.7273.7S28 / S28
May0.3448.2S28 / S28
June0.0538.4S28 / S28
July0.0582.8S28 / S28
August0.0589.0S28 / S28
September0.0*532.4S28 / S28
October3.4387.8S28 / S28
November33.7177.8S29 / S29
December104.8101.7S29 / S29
Open NOAA's original station CSV ↗

How Lonta built the calendar

We selected 24 US city references to show different regional patterns, using one identifiable airport station for each. This is a purposive selection, not a population-weighted national estimate, a list of the biggest markets or a sample of our clients. Station names and coordinates are NOAA's, including historical airport names in the source files.

On October 9, 2026, we downloaded each station's original monthly file from NOAA NCEI's 1991–2020 U.S. Climate Normals. We extracted MLY-HTDD-NORMAL and MLY-CLDD-NORMAL, their measurement and completeness flags, and their years fields. Both variables use a 65°F base. There are 288 station-month records and 576 degree-day values; months and variables are not independent weather stations.

What a degree day means

A degree day accumulates temperature departure from a base. In the National Weather Service's daily explanation, a 78°F daily mean gives 13 cooling degree days above 65°F; a 29°F mean gives 36 heating degree days below it. A monthly total combines days. It does not count days with broken air conditioners or households ready to buy.

We use NOAA's published monthly degree-day variables directly. We do not estimate them by subtracting 65°F from a monthly mean temperature. NOAA's constrained daily temperatures and normals methodology supply the original calculations.

What we calculated

  • Peak month: the month with the largest heating or cooling normal. All tied peaks are retained.
  • 12-month total: the sum of the twelve published monthly values, rather than a separately downloaded annual normal.
  • Three-month concentration: the sum of the three largest monthly values divided by that 12-month total. Equal values at the third-month cutoff use calendar order; the share is unchanged by that tie choice.
  • Lowest combined month: the minimum monthly heating + cooling total, without business weights. All tied minima are retained.

Coverage and limits

All 576 selected values are present. NOAA marks 526 Standard and 50 Representative; 13 have an X measurement flag for rounding to zero. These flags are copied from the source, not reclassified from their year counts. NOAA can estimate missing years using surrounding stations. A 30-year normal therefore does not mean every value has 30 complete observed years.

The period is 1991–2020. It describes a historical baseline, not current weather, recent warming or an upcoming heat wave. Airport siting, coastlines, elevation and urban conditions can make your service area differ. Humidity, equipment stock, household income, outages, maintenance plans, auction competition and your capacity are outside this dataset.

No jobs, leads, search volumes, ad-account records or revenue observations are included. The calculations do not estimate contractor demand or advertising lift. The checks establish that the selected records and calculations match the published NOAA files; they are not an independent audit of NOAA's underlying climate model.

Download the data. Keep the station attached.

Free, without registration. The 288-row CSV and JSON keep coordinates, period, units, flags, year counts, original station URLs and source-file hashes. The chart summarizes the peak months; the complete records remain the reference.

Suggested citation

Lonta AI. HVAC Seasonality Calendar: 24 US City Reference Stations. Version 1.0. Analysis of NOAA NCEI's 1991–2020 monthly climate normals. Source files retrieved October 9, 2026. lonta.io/research/hvac-seasonality/.

Cite NOAA for the published climate values and Lonta for the selection, comparison and analysis. Preserve the station, base temperature and normals period when reusing a figure.

Primary sources and definitions

Checked October 9, 2026. Each station's original CSV is linked in its record.

Using a local HVAC calendar

When is the HVAC busy season?

Heating and cooling exposure has a local calendar. In this selected NOAA dataset, the largest monthly cooling normal occurs in July at Phoenix Sky Harbor, August at Dallas–Fort Worth Airport and September at San Francisco International. Those station normals do not measure the months with the most service calls or jobs.

Are these current weather data?

No. These are NOAA's monthly climate normals for 1991–2020, downloaded October 9, 2026. A normal describes a historical seasonal pattern. It is not a 2026 observation or a forecast.

Can I allocate my advertising budget using these percentages?

The percentages describe the concentration of degree days across months. They do not describe shares of annual leads, repairs, replacements or revenue. Set a budget from your own job economics, available capacity and measured demand, with climate as one planning input.

Why use an airport station instead of a city average?

These are identifiable NOAA station records with monthly degree-day normals, source files and quality flags. One airport is an explicit reference point, not a city-wide average. Coastal neighborhoods, elevation and inland service areas can differ from it.

Bring the calendar into your next account review

  1. Choose a station near your actual service addresses. Check elevation and coastal or inland differences.
  2. Compare the monthly pattern with your own repair, replacement and maintenance jobs. Keep new, returning and unknown customers separate.
  3. Write staffed phone hours and available technician hours beside the busiest months.
  4. Check the current forecast and actual weather before changing a live campaign. A climate normal is a planning baseline.
  5. Use your own retained job contribution and capacity to set a spending ceiling.
Use the lead cost calculator for that spending ceiling, and the weather and agency results worksheet to review a claimed improvement. The marketing benchmark evidence review explains how other industry figures change with their definitions.

More Lonta research and tools. Lonta runs HVAC marketing; the free written strategy starts with your own service area and measurement gaps.

Request your free strategy

One page, five details, no card and no call.

Would rather talk it through? Ask for a callback on the form and pick a window. The person who would run your account calls you, not a salesperson.

This sets the testing pace. There is no minimum.

A good callback window or the first problem you want us to look at

No card and no call. Read-only access only.