Skip to content
Back

Lonta Research · 2023 AHS analysis

Home-service demand is not one average.

Your plumbing and HVAC work do not share one demand profile. This home-service demand study separates how often owner homes report a project, who does most of the work and how spending is distributed — before asking what it means for your marketing.

28,192

occupied owner homes in the analyzed sample
44,689 reported projects across all source categories
Eight prespecified service categories below

Historical survey context. No client results or advertising effect inferred.

Analysis by Lonta AI · Prepared October 12, 2026 · Version 1.0 · How we write

Three results worth keeping separate

The oldest homes do not lead every service.

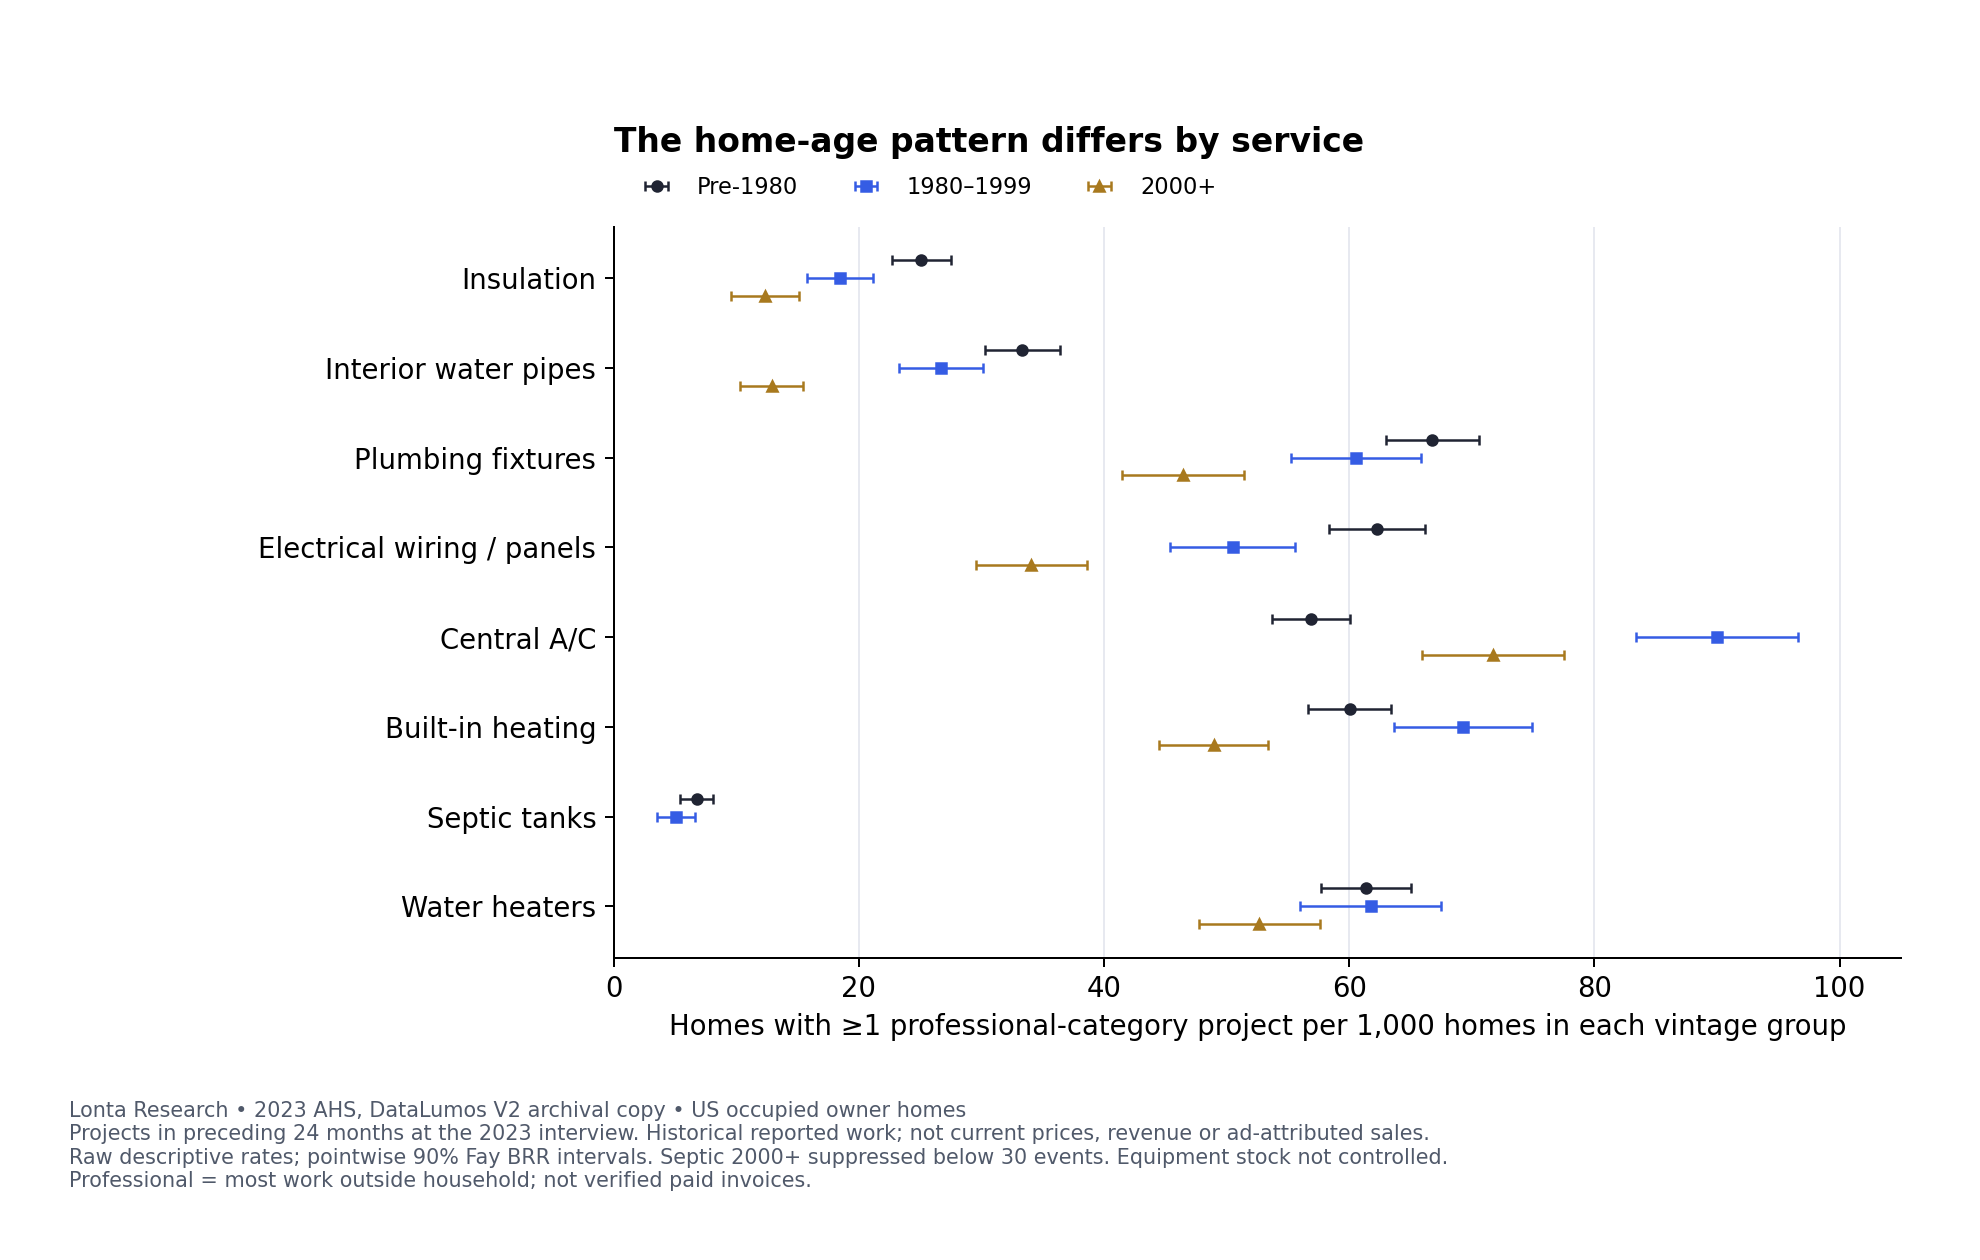
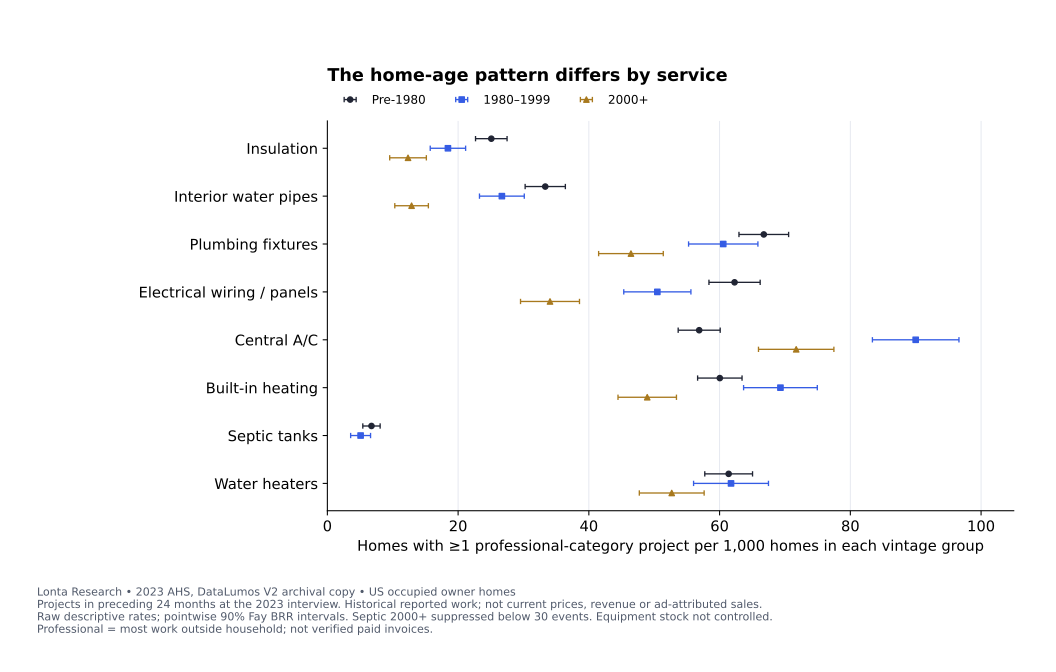
Professional central A/C projects were reported by 90.0 per 1,000 owner homes built in 1980–1999, versus 56.9 for pre-1980 homes. The descriptive difference remains in the prespecified income/division model. Home age is not equipment age, and the survey does not identify the cause.

Check the age comparison →

A count share can miss the spending mix.

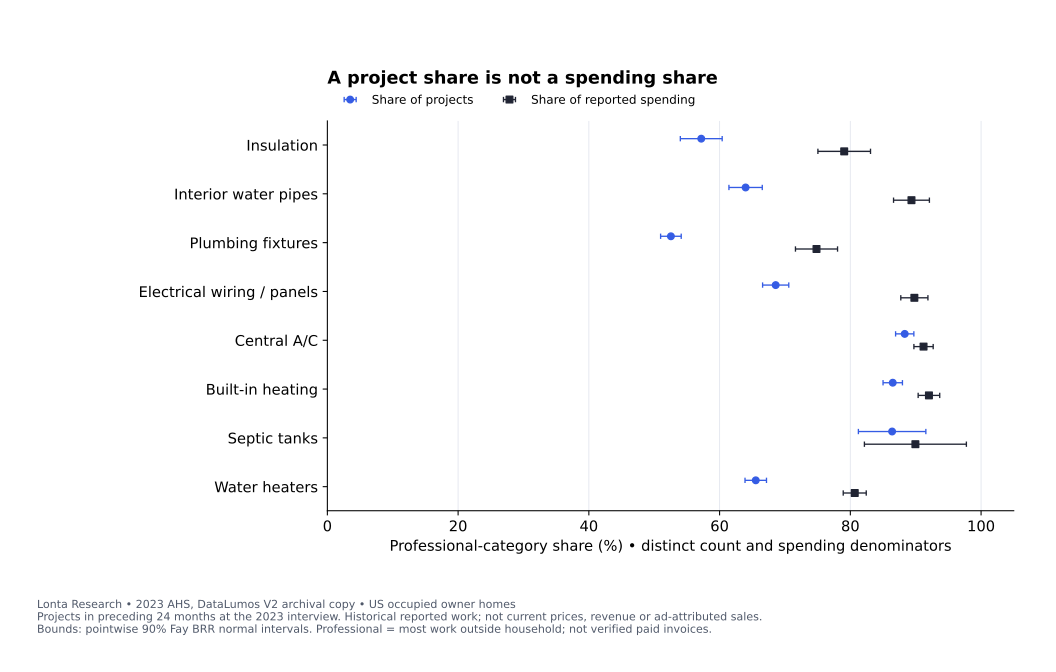
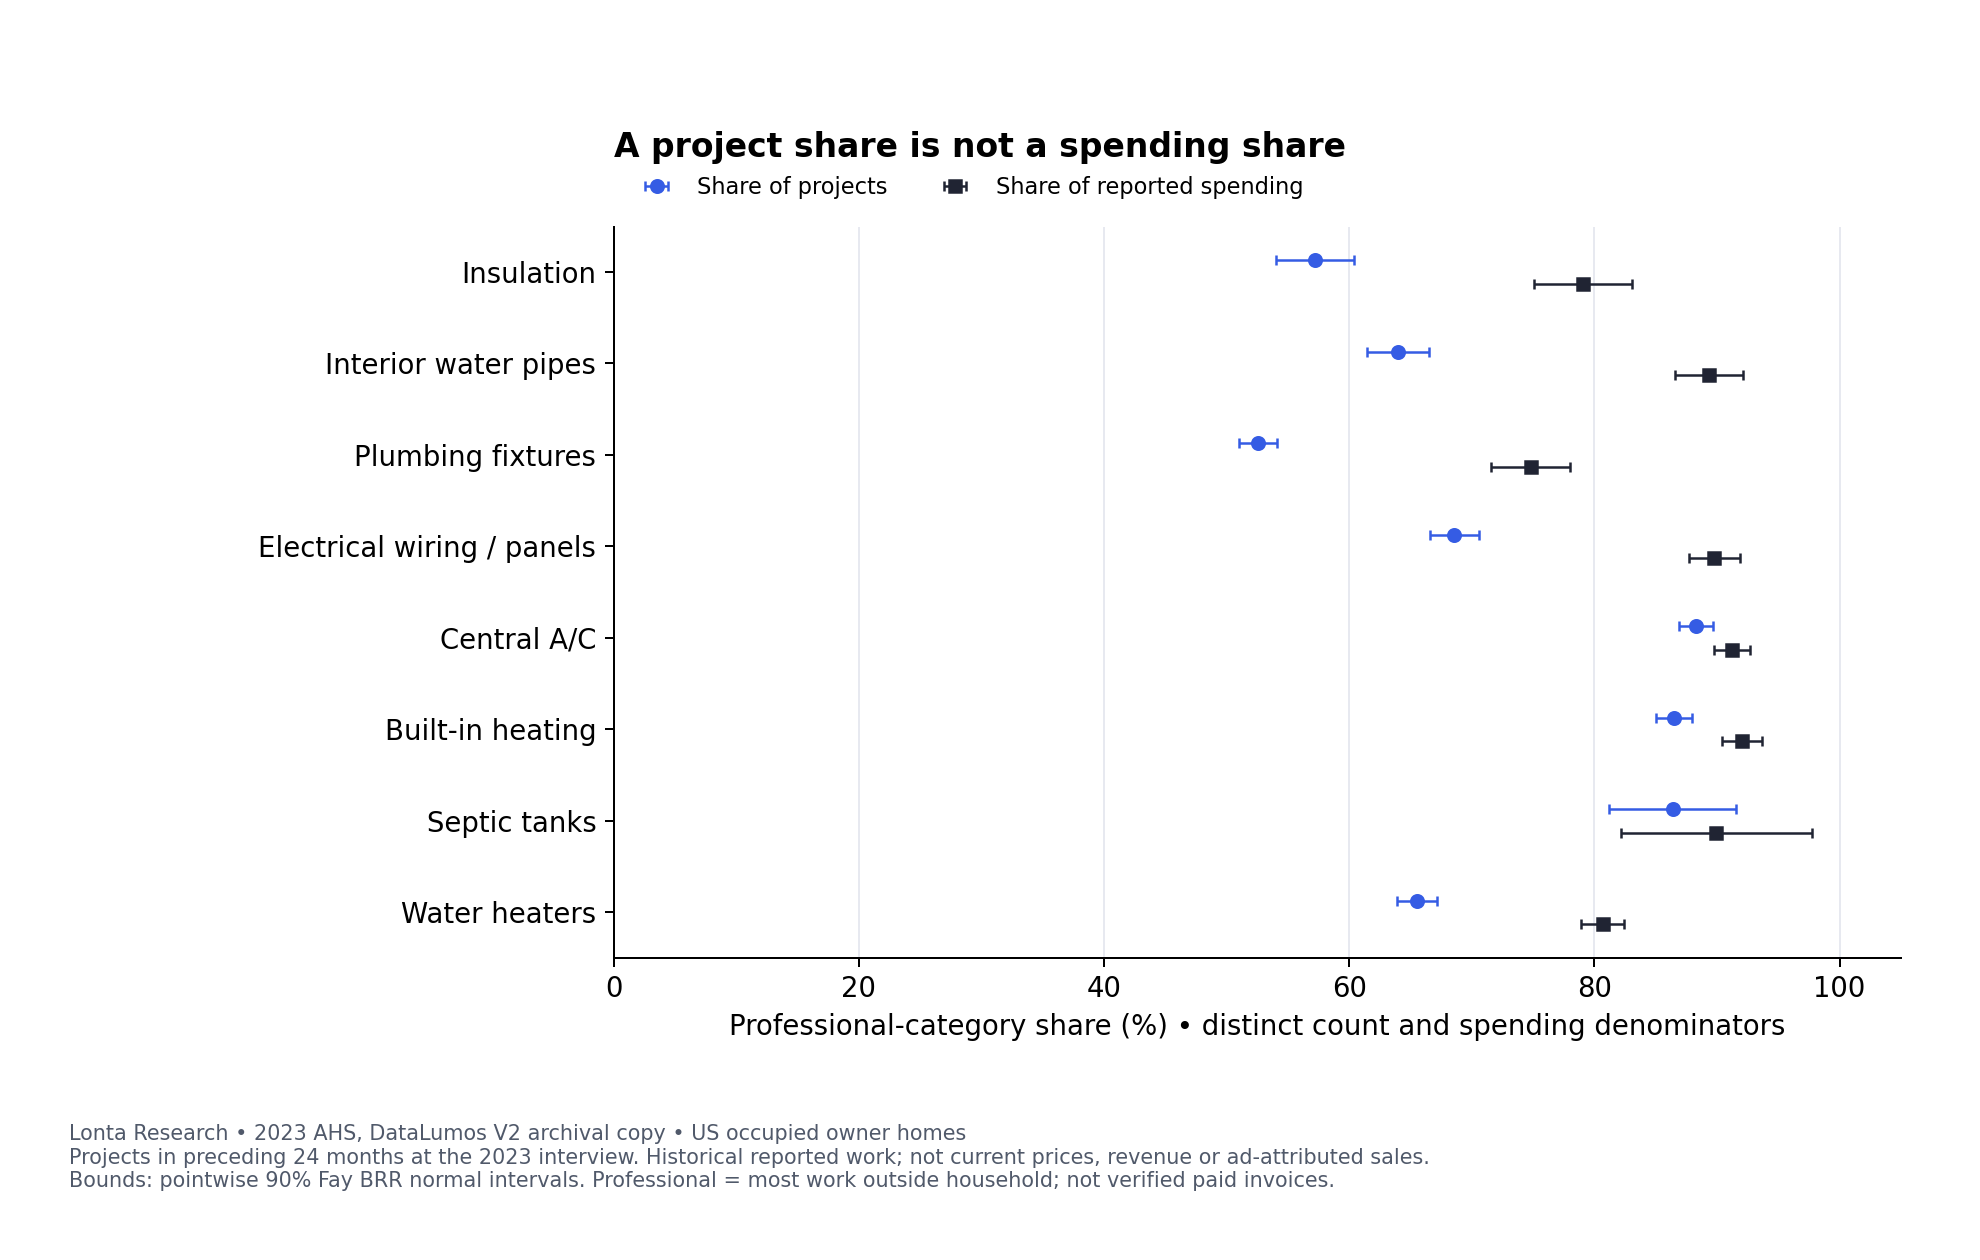
For plumbing fixtures, the professional category represents 52.6% of projects but 74.8% of known spending. The paired gap is 22.3 percentage points, with a pointwise 90% interval of 19.4–25.1. This is a project/outlay comparison, not a contractor profit share.

Inspect both denominators →

The typical cost is a range.

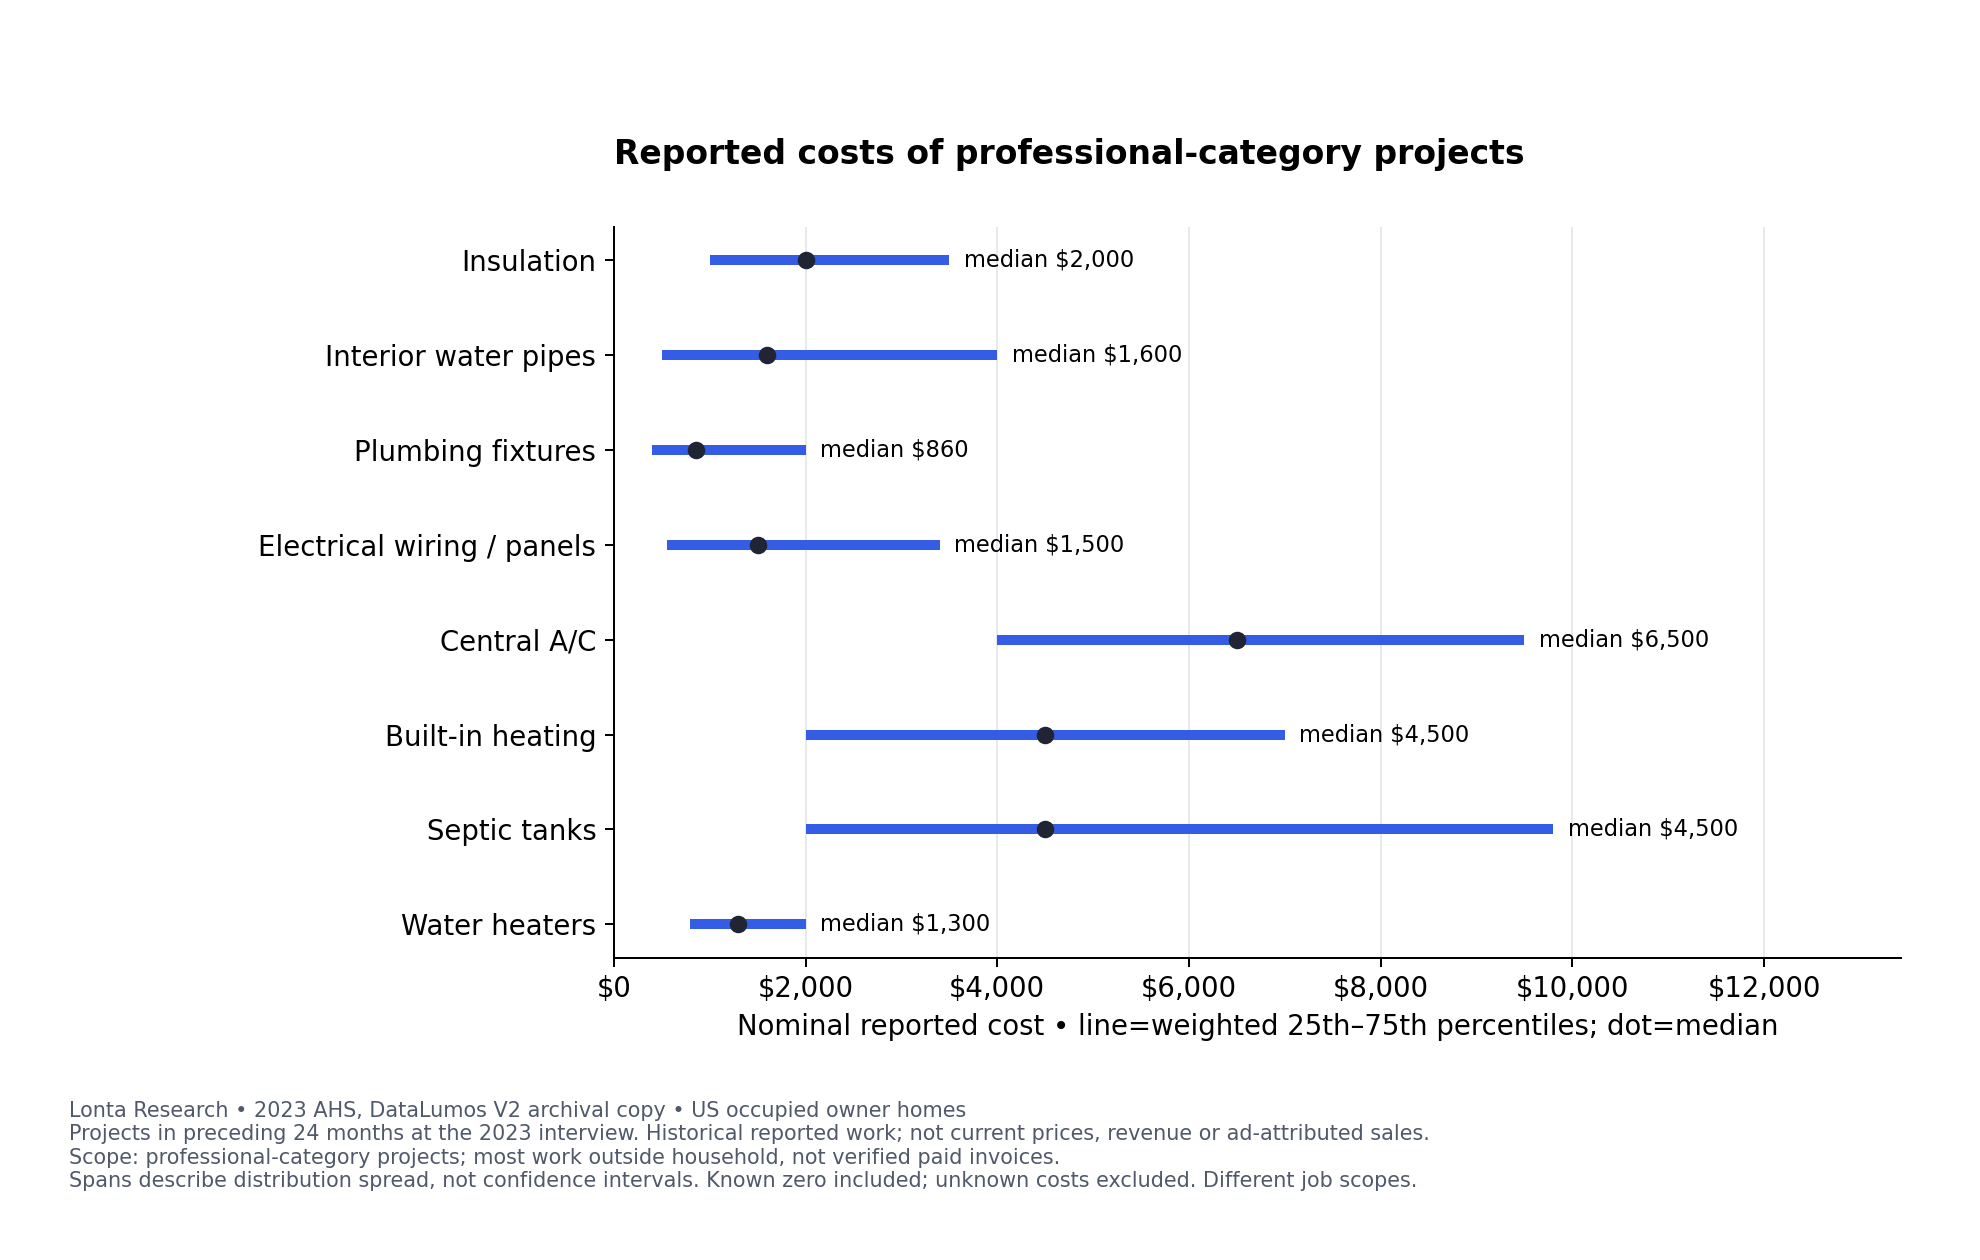
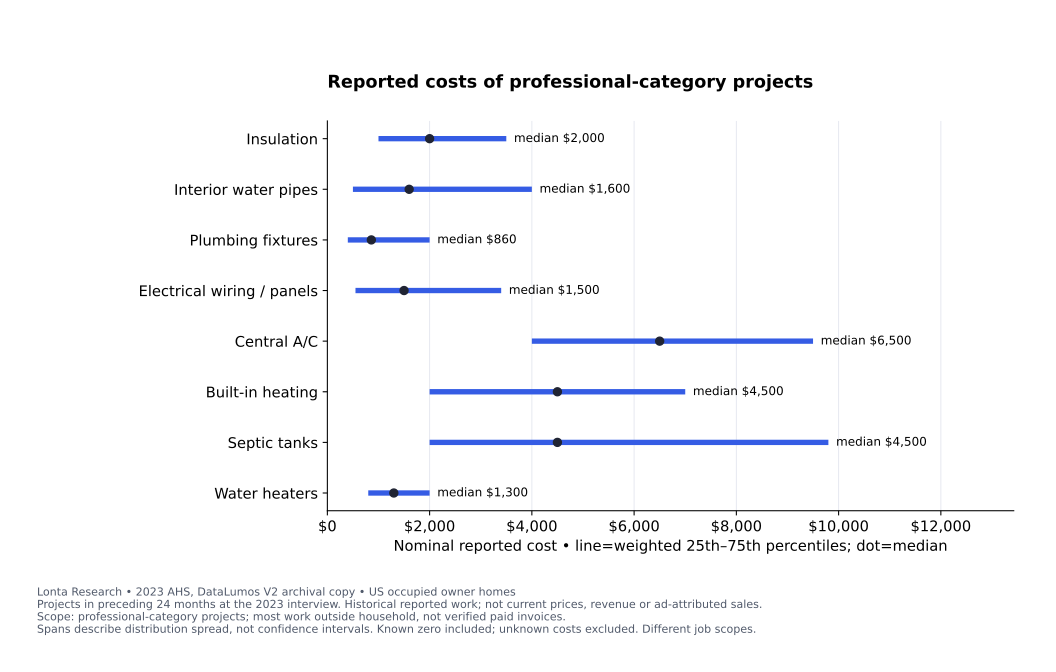
The professional-category central A/C median is $6,500, while the middle half of reported job costs spans $4,000–$9,500. Different addition and replacement scopes contribute to this historical distribution. These amounts are not current quotes or a margin estimate.

Read the cost distribution →

These results describe US occupied owner homes and projects reported for the preceding 24 months at the 2023 interview. They do not describe every service call, current local demand or a calendar-year 2023 total. Census's professional category means most work was done outside the household; paid contractor invoices are not verified.

If your report gives plumbing fixture work and central A/C work one undifferentiated average ticket, it can hide their different scope and spending distributions. The practical next step is to measure the job mix in your own inquiries and collected work, rather than substitute these national figures for your economics.

How often did homes report professional-category work?

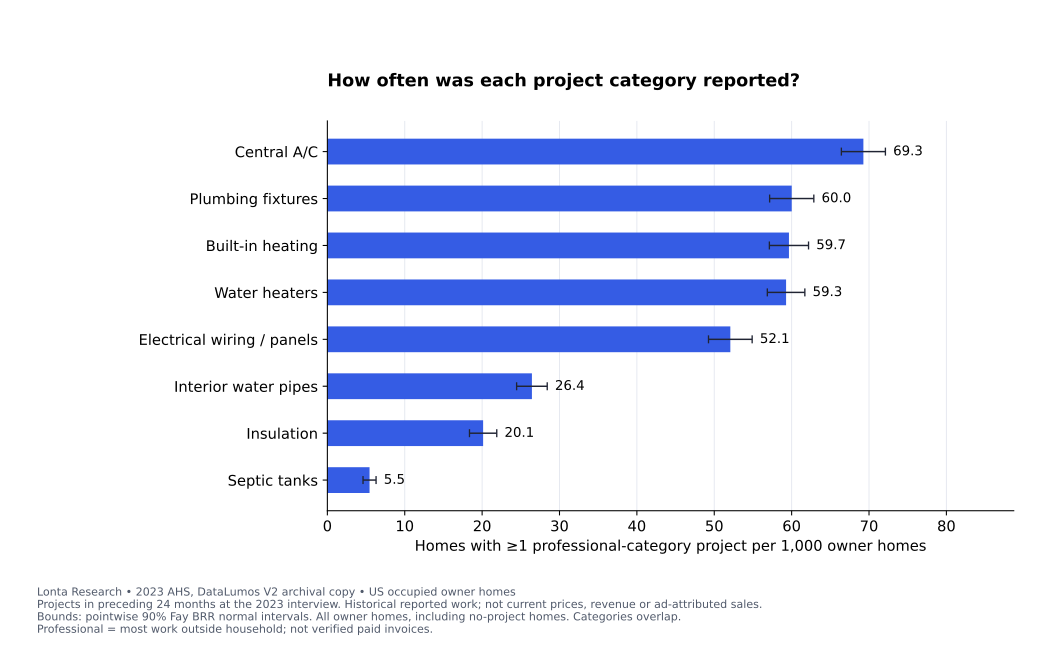
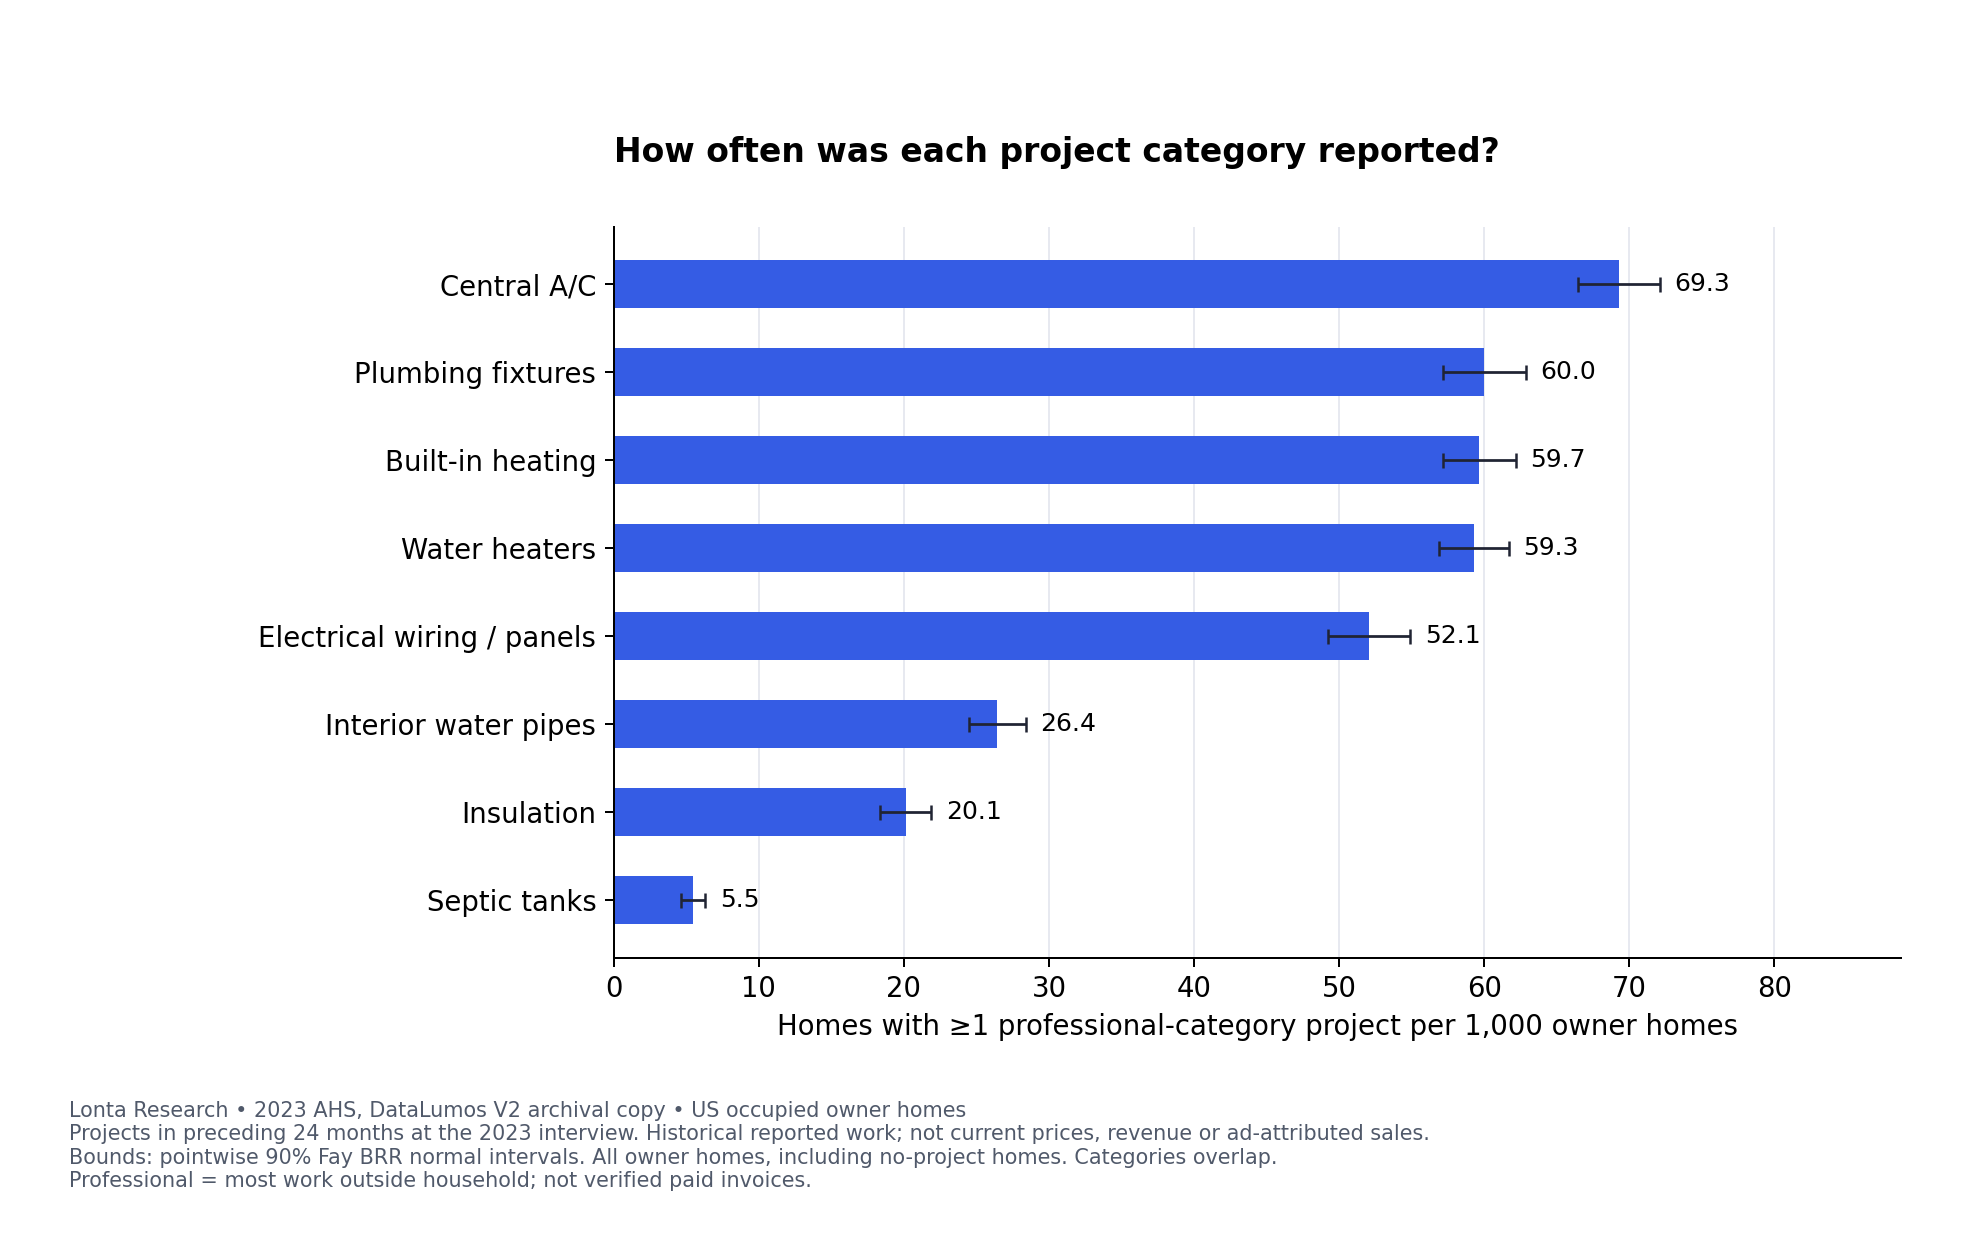
The denominator is all 28,192 eligible owner homes, including the 11,669 with no reported improvement project. One home can appear in several service categories, but counts at most once within each category. A rate of 69.3 per 1,000 is about 6.9% over this recall window, not an annual failure rate or a count of leads available to buy.

Homes with at least one qualifying project per 1,000 occupied owner homes; pointwise 90% intervals
Project categoryHomes / 1,00090% intervalSample homes with work
Insulation20.118.4–21.9588
Interior water pipes26.424.5–28.4785
Plumbing fixtures60.057.2–62.91,734
Electrical wiring / panels52.149.3–54.91,497
Central A/C69.366.4–72.12,050
Built-in heating59.757.1–62.21,764
Septic tanks5.54.6–6.3129
Water heaters59.356.9–61.71,847
Professional-category project frequency across eight services — open chart
Professional-category project frequency across eight services

Weighted household participation, with no-project owner homes retained. Categories overlap and must not be added together. On a phone, scroll the chart sideways. The numerical table provides the same values.

Septic work is uncommon across all owner homes, partly because this denominator includes homes that do not use septic systems. The study does not estimate a rate conditional on having a septic system. A national all-home rate cannot decide whether a septic specialist's particular service area is attractive.

Who does the work, and where does the reported spending go?

Project share weights each recorded project. Spending share weights its reported cost. The first excludes unknown professional/DIY classifications; the second also excludes unknown costs. Missing amounts are not silently turned into zero.

For central A/C, the professional category already accounts for 88.3% of projects, with a smaller 2.9-point spending gap. For plumbing fixtures, the gap is 22.3 points. Different job scopes, material costs and household labor can contribute to these patterns; the survey comparison does not isolate their causes.

Professional-category shares; paired spending-minus-project differences use the same 160 replicate weights
CategoryProjectsSpendingGap (points)90% gap interval
Insulation57.2%79.1%21.918.2–25.6
Interior water pipes64.0%89.4%25.422.0–28.7
Plumbing fixtures52.6%74.8%22.319.4–25.1
Electrical wiring / panels68.6%89.8%21.219.0–23.5
Central A/C88.3%91.2%2.91.9–3.9
Built-in heating86.5%92.0%5.54.0–7.1
Septic tanks86.4%90.0%3.6-4.1–11.2
Water heaters65.5%80.7%15.113.6–16.7
Professional shares of projects and reported spending — open chart
Professional shares of projects and reported spending

Chart bounds are separate pointwise 90% intervals. The table's gap interval accounts for paired replicate covariance. Overlap of two standalone intervals is not the difference test. On a phone, scroll the chart sideways. The numerical table provides the same values.

Does the home-age pattern survive an income and region adjustment?

Central A/C has a middle-vintage peak: 56.9, 90.0 and 71.7 qualifying homes per 1,000 for pre-1980, 1980–1999 and 2000+ owner homes. Electrical wiring, panels and built-in lighting have a different raw pattern: 62.3, 50.5 and 34.1.

We fixed the three age groups, three income bands and nine Census divisions before weighted service outcomes were calculated. A descriptive weighted linear probability model compares age groups while accounting for the prespecified income and division indicators. For central A/C, the adjusted 1980–1999 versus pre-1980 difference is 27.1 homes per 1,000 (90% interval 20.1–34.2).

Raw professional-project participation per 1,000 homes in each vintage group; 90% intervals
CategoryPre-19801980–19992000+
Insulation25.1
22.7–27.5
18.4
15.7–21.2
12.3
9.5–15.1
Interior water pipes33.3
30.3–36.4
26.7
23.3–30.1
12.9
10.3–15.5
Plumbing fixtures66.8
63.0–70.6
60.6
55.3–65.9
46.4
41.5–51.4
Electrical wiring / panels62.3
58.4–66.2
50.5
45.3–55.6
34.1
29.5–38.6
Central A/C56.9
53.7–60.1
90.0
83.4–96.6
71.7
65.9–77.5
Built-in heating60.0
56.6–63.4
69.3
63.7–74.9
48.9
44.5–53.4
Septic tanks6.7
5.4–8.1
5.1
3.6–6.6
Suppressed
Water heaters61.4
57.7–65.0
61.7
56.0–67.5
52.7
47.7–57.6
Home vintage and professional-category project participation — open chart
Home vintage and professional-category project participation

Raw descriptive rates, with pointwise 90% intervals. The small septic 2000+ cell is suppressed under the prespecified publication policy. On a phone, scroll the chart sideways. The numerical table provides the same values.

Inspect all income/division-adjusted age contrasts
Differences per 1,000 owner homes versus pre-1980; descriptive associations, not causal effects
CategoryComparison groupDifference90% interval
Insulation1980–1999-7.4-10.7–-4.2
Insulation2000+-15.1-18.6–-11.7
Interior water pipes1980–1999-8.3-12.4–-4.2
Interior water pipes2000+-23.6-28.0–-19.2
Plumbing fixtures1980–1999-7.8-14.2–-1.4
Plumbing fixtures2000+-24.1-29.9–-18.4
Electrical wiring / panels1980–1999-14.1-19.7–-8.6
Electrical wiring / panels2000+-34.6-41.4–-27.9
Central A/C1980–199927.120.1–34.2
Central A/C2000+3.0-3.8–9.8
Built-in heating1980–199911.34.6–18.0
Built-in heating2000+-10.3-16.3–-4.2
Septic tanks1980–1999-1.8-3.7–0.0
Septic tanks2000+SuppressedWithheld
Water heaters1980–1999-1.6-8.7–5.5
Water heaters2000+-13.3-20.5–-6.2

The adjustment does not control prior equipment prevalence, housing type, metro, ownership duration or every income difference. Recently built homes may have less time in which a project could occur. The linear model is used for group contrasts, not individual predictions. We did not test an age-based ad campaign, and the results cannot establish that buying ads around a particular housing vintage will improve returns.

How wide is typical reported project spending?

The central A/C professional-category median is $6,500; the middle half spans $4,000–$9,500. The range is an interquartile range, not a confidence interval. It shows variation across reported jobs. The CSV separately provides a replicate-based normal approximation to the median's 90% uncertainty interval.

Professional-category projects with known nonnegative cost, including zero; nominal historical dollars
CategoryKnown-cost sample projects25th percentileMedian75th percentile
Insulation588$1,000$2,000$3,500
Interior water pipes785$500$1,600$4,000
Plumbing fixtures1,734$400$860$2,000
Electrical wiring / panels1,497$550$1,500$3,400
Central A/C2,050$4,000$6,500$9,500
Built-in heating1,764$2,000$4,500$7,000
Septic tanks126$2,000$4,500$9,800
Water heaters1,847$800$1,300$2,000
Weighted professional-project cost medians and interquartile ranges — open chart
Weighted professional-project cost medians and interquartile ranges

Different addition/replacement scopes; known zero included. The $1,500 electrical median combines wiring, panels, fuse boxes and built-in lighting, so it is not a panel-replacement price. On a phone, scroll the chart sideways. The numerical table provides the same values.

Reported cost can include materials and amounts paid by insurance; the homeowner's own time is excluded. Costs are subject to disclosure rounding/topcoding. Three professional-category septic projects lack a reported amount: they still contribute to household participation and project share, but not to the cost distribution or spending share.

Finished-only and literal cost-flag-zero sensitivity medians are retained in the JSON and code. For central A/C these are $6,600 and $6,300, versus the $6,500 base median. The flags are described literally rather than treated as a claim that every remaining amount was independently verified. These checks do not turn survey costs into your margin or today's quote.

Method, source provenance and limitations

The controlling source is the DataLumos/ICPSR 217661, version V2 archive of the 2023 AHS National PUF. The two analyzed CSV files are pinned by SHA-256 in the companion. Their source rows contain 55,669 housing units and 44,689 projects; 28,192 homes meet the occupied-owner universe. ICPSR distributes these files as deposited, without its own processing or quality review. Repository V2 is not the Census release number.

We validated unique household keys, the many-to-one project join and source project counts. Repeated household/category pairs and identical project rows were retained rather than automatically deleted: removing them would change the source's project totals. No raw housing-unit identifiers or records are included in the public downloads.

183 selected control comparisons passed against the official Census 2023 PUF verification workbook, covering occupied/owner totals and all C-16 project-count, spending, positive-cost median/mean rows and available count margins. Comparison is at the workbook's displayed precision. The primary workbook was read as parsed document text; original binary XLSX bytes were not acquired. PUF controls are distinct from Table Creator's internal-use-file figures. The comparison receipt preserves those differences and the display conventions.

The actual archived edition is verified and its business fields are corroborated with Census's 2023 definitions, questionnaire and control specifications, alongside the pinned archived dictionary. We do not assert a direct Census download or a bitwise match to an original Census ZIP. The code validates the CSV contents separately from ZIP compression and timestamps.

All eight service categories are fixed in advance of weighted outcomes. Unweighted schema and code frequencies had already been inspected, so this is not claimed as full preregistration before any data inspection. Pre-2010 construction dates are grouped source codes, not exact individual years. Household participation retains every eligible no-project home; project statistics copy the housing unit's final and 160 supplied replicate weights onto its project rows.

The Census/HUD replicate-weight guide specifies Fay BRR variance: 4/160 times the sum of squared replicate deviations from the full estimate. Ratios recompute both numerator and denominator per replicate; share differences retain paired covariance. Weighted quantiles use an inverse empirical CDF. Study intervals use a pointwise 90% normal approximation, without multiplicity correction. They do not measure nonresponse, recall error or unmeasured confounding.

The publication policy requires at least 100 unweighted eligible homes and 30 qualifying homes per subgroup; it is Lonta's policy, not a Census standard. One septic 2000+ cell and its corresponding adjusted contrast are withheld everywhere, including exports. Census-control medians/means use positive costs; the research's category cost distributions intentionally retain known nonnegative amounts. These are separate, explicitly defined calculations.

This is historical improvement/replacement work, excluding many routine maintenance and emergency-call outcomes. It is not contractor revenue, profit, ad attribution or a 2026 demand forecast. It is original secondary analysis of one survey, not a pooled meta-analysis or a Lonta client study. Prepared with Codex; no independent or human-review claim is made.
Turn the research into one local question

  1. Choose one service and exact job scope that your team can deliver. Keep repairs, fixture changes and equipment additions/replacements distinct.
  2. Write one message or offer hypothesis and an alternative explanation before seeing the local result. Home age can be context; this study does not validate it as an individual targeting rule.
  3. Record serviceable inquiries, quoted amounts, accepted work, completion, collected revenue and variable costs separately. Preserve unknowns and customer history.
  4. Use a fixed follow-up window so new leads receive the same time to sell as old ones. Match source/attribution rules and technician capacity.
  5. Assess collected contribution and failed-dispatch costs locally before changing spend. Your own economics set the advertising ceiling.

Start with the service-mix hypothesis worksheet, equal-age lead comparison and dispatch-aware lead cost calculator. You can use the research and worksheet without buying Lonta.

Download, reproduce and cite

The aggregate data retain the population, period and definitions. The source-only package contains code, 46 tests, the executed notebook, selected primary control specifications, figures and the worksheet. Download the actual survey archive through its own normal access flow; it is not redistributed here.

Suggested citation

Lonta AI (2026). Home-Service Demand Study: home age, professional work and spending. Version 1.0. Original secondary analysis of the 2023 American Housing Survey, using DataLumos 217661/V2. https://lonta.io/research/home-service-demand/.

Cite Census/HUD for the original survey, DataLumos DOI 10.3886/E217661V2 for the archived copy used, and Lonta for these particular calculations and comparisons. Preserve the owner-home universe, recall window and professional-category definition with each reused result.

Lonta's original code: MIT. Original figures, aggregate exports, commentary and worksheet: CC BY 4.0. Underlying sources retain their own rights and access terms. These are company-published findings, without a Census/HUD endorsement.

Questions about using the study

Do older homes always mean more HVAC work?

The observed pattern depends on the service. In this 2023 AHS analysis, professional central A/C projects were more frequent among owner homes built in 1980–1999 than among pre-1980 homes. The survey does not establish the reason or show that an age-based advertising campaign will perform better.

Does professional work mean a paid contractor invoice?

No. The AHS classification asks whether someone in the household did most of the work. This analysis uses the Census professional category when most work was done outside the household; it does not verify an invoice, licensing or contractor revenue.

Is the $6,500 central A/C median a current replacement quote?

No. It is a weighted median of historical reported professional-category job costs across different addition and replacement scopes. Materials may be included. These are nominal costs reported for the 24 months preceding the 2023 interview, with known zero costs retained; they are not a local 2026 price list.

Can I turn these figures into an advertising budget?

Use them to formulate a service or message hypothesis, then test it locally. Historical household participation and reported spending do not measure serviceable leads, paid jobs, contribution margin, available capacity or incremental advertising results.

Is this a meta-analysis or a client study?

This is original secondary analysis of one public survey dataset. It does not pool independent studies and contains no Lonta client observations. The actual archival edition, input hashes, primary control comparisons and code are available below.

Bring the question into your next marketing review

For local climate context, use the HVAC seasonality calendar. For agency promises, compare what marketing benchmarks actually count and what a monthly agency price buys.

Lonta runs marketing for HVAC, plumbing and electrical businesses. The free written strategy starts with your service area, job mix and measurement gaps.

All Lonta research and tools.

Request your free strategy

One page, five details, no card and no call.

Would rather talk it through? Ask for a callback on the form and pick a window. The person who would run your account calls you, not a salesperson.

This sets the testing pace. There is no minimum.

A good callback window or the first problem you want us to look at

No card and no call. Read-only access only.